AdamBots Automated Scouting Kit
FIRST Robotics Competition
For six weeks each winter, high-school students in more than 25 countries devote their evenings, nights, and weekends to build game-playing robots as part of the FIRST Robotics Competition (FRC). The robots are designed, built, and programmed by students, with guidance from industry professionals (aka parents!) who volunteer their time.
To encourage innovation, the rules of the game change each year. Starting from January, students are allowed six weeks to design, build, program, and test their robots before competitions begin in March. During competition season, many teams compete weekly or biweekly in their region for a chance to advance to the world championships in April.
During the 2011-2013 seasons, I was a member of the AdamBots (Team #245), where I led a group of students in programming our team’s robot. Once build season is over, no major changes are allowed to the robot, including code, so Curtis Fenner and I searched for a way to use our programming skills to help give our team a strategic edge during competition season. The result was AdamBots Automated Scouting Kit!
Scouting & Alliance Selection
Each competition consists of a series qualification matches between two alliances, red and blue, consisting of three randomly-assigned teams each. Robots on the same alliance work together to defeat robots on the opposing alliance. At the end of each match, the score of each alliance as a whole is reported. Following the qualification matches, teams with a high enough aggregate score advance to the elimination rounds and are allowed to choose permanent alliance partners.
The simplest alliance selection strategy would be to choose two teams which have accumulated the most points during the qualification rounds. However, since FIRST only reports aggregate alliance scores, this strategy is not ideal; good robots may have been dragged down by consistently underperforming partners.
In preparation for alliance selection, many teams employ scouts to take handwritten notes about the performance of other teams during the qualification matches. Scouts make note of robots with special abilities, adept human operators, or frequent mechanical failures. Scouts on our team also attempted to manually track the points contributed by each individual alliance member, in order to estimate the expected score contributed by a potential alliance partner. However, six teams particpate in each match, requiring six scouts for accurate reporting. At some events, there may even be two or three matches happening simultaneously. Predictably, this form of manual scouting was labor intensive and error prone!
AdamBots Automated Scouting Kit
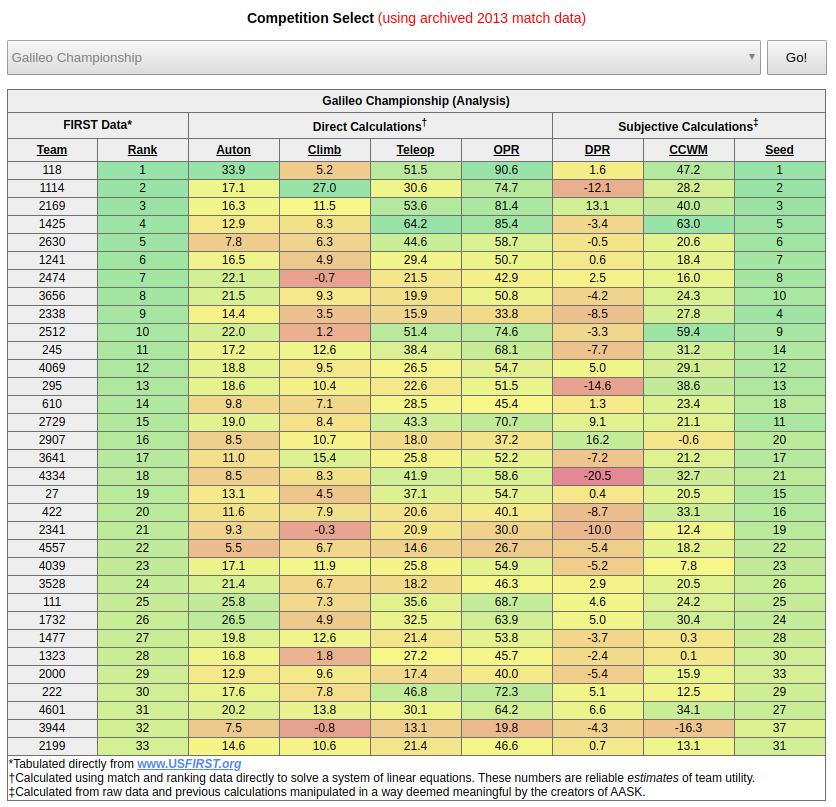
Our automated scouting kit analyzes real-time competition data published by FIRST and displays the results on a web page that can be accessed during and after each competition. We perform several computations to estimate the performance of each team individually, based on aggregate alliance scores:
- Auton Score: Estimated points scored, on average, during the autonomous phase.
- Climb Score: Estimated points scored, on average, by climbing the pyramid.
- Teleop Score: Estimated points scored, on average, during the human-operated phase.
- Offensive Power Rating (OPR): An estimate of the total points scored, on average. This number represents the offensive utility of a team.
- Defensive Power Rating (DPR): An estimate of the defensive utility of a team. May be interpreted as the number of points that a team takes away from its opposing alliance, on average.
- Calculated Contribution to Winning Margin (CCWM): An estimate of the number of points a team contributes to the winning margin of its alliance. May be negative if the team consistently loses!
Based on these computations, we also provide:
- Predictions of all past and future match scores, based on the official schedule.
- Predictions for hypothetical matches between potential alliance partners.
- A correlation matrix for all of our computed metrics.
- A graph of the winning and losing scores over time.
- A histogram of the OPR and CCWM of all participating teams.
Originally, AASK scraped competition data from the FIRST website, but unfortunately the old match data is no longer available. Instead, the demo hosted here runs with cached match data from the 2013 World Championship. See below for a screenshot, followed by an explanation of the mathematical details.
Mathematical Details
Data Format
Suppose we have data about teams competing in matches. During each match, two alliances of three teams each compete to score the most points. During competition, FIRST publishes a real-time match results table containing total alliance scores for each match. For example:
| Red Alliance | Red Score | Blue Score | Blue Alliance |
|---|---|---|---|
| Team 48, 49, 50 | 71 | 174 | Team 51, 52, 53 |
| Team 54, 55, 56 | 70 | 122 | Team 57, 58, 59 |
| Team 60, 61, 17 | 160 | 186 | Team 62, 63, 16 |
| Team 13, 5, 34 | 92 | 105 | Team 28, 14, 18 |
| Team 9, 0, 36 | 113 | 89 | Team 10, 23, 28 |
During the 2013 season, each match consisted of three phases: Autonomus Period (AP), Climb Period (CP), and Teleoperated Period (TP). Points scored during each individual phase by an alliance are recorded for each match, but not reported publicly. Instead, for each team, the rankings table reports the aggregate points earned as part of an alliance during each phase, summed across all matches played so far. This table also contains the Win/Tie/Loss record and qualificaiton score for each team.
| Rank | Team | QS | AP | CP | TP | Record |
|---|---|---|---|---|---|---|
| 1 | 118 | 16.0 | 394 | 170 | 636 | 8-0-0 |
| 2 | 1114 | 14.0 | 336 | 320 | 636 | 7-1-0 |
| 3 | 2169 | 14.0 | 304 | 210 | 679 | 7-1-0 |
| 4 | 1425 | 14.0 | 300 | 220 | 758 | 7-1-0 |
| 5 | 2630 | 13.0 | 250 | 130 | 794 | 6-1-1 |
| 6 | 1241 | 12.0 | 330 | 170 | 644 | 6-0-2 |
Modeling Assumptions
Many factors contribute to the overall performance of a team, and the complex interactions between allied and opposing teams are difficult to model directly. For simplicity, we assume that each team possesses an intrinsic offensive power rating (OPR), denoted , representing the number of points a team contributes, on average, to the total score of it alliance.
Match Prediction
Under our model, the score of an alliance during each qualification match is determined by adding up the OPR of each alliance member. More precisely, if the red alliance for a match consists of teams , , and , and the blue alliance consists of teams , , and , we predict the following match outcome:
Rank Prediction
Let’s see how this model can be used to predict the outcomes of the qualification rounds as a whole. Suppose we have the following match schedule for teams playing matches. Further, suppose we already know the offensive power rating for every team, which we store in a vector .
| Match | Red Alliance | Blue Alliance |
|---|---|---|
| 1 | Team 0, 1, 2 | Team 3, 4, 5 |
| 2 | Team 1, 3, 5 | Team 0, 2, 4 |
| 3 | Team 0, 1, 3 | Team 2, 4, 5 |
| 4 | Team 1, 3, 4 | Team 0, 2, 5 |
| 5 | Team 0, 4, 5 | Team 1, 2, 3 |
| 6 | Team 1, 4, 3 | Team 0, 2, 5 |
| Team | 0 | 1 | 2 | 3 | 4 | 5 |
|---|---|---|---|---|---|---|
| OPR | 0.28 | 5.91 | 9.96 | 3.23 | 4.61 | 5.17 |
To predict the aggregate score for a single team during the qualification rounds, we add up the OPRs for the teams it has allied with. For example, team 3 participated in all six matches, playing with team 0 once, team 1 five times, team 2 once, team 4 three times, and team 5 twice. Therefore, we predict the total score accumulated by team 3 during the qualification rounds to be:
We can do this for each team to compute a vector of qualification scores. Note that the above computation looks suspiciously like a dot product, suggesting that we can compute qualification scores using matrix-vector multiplication. Define the alliance matrix to have entries indicating the number of matches for which team allied with team . Below is the alliance matrix for our sample schedule.
The alliance matrix is symmetric () with nonnegative entries. The diagonal entries count the number of matches Team has played. Qualification scores can be computed by multiplying the OPR vector by the alliance matrix as follows:
Computations
Offensive Power Rating
Since we know both the alliance matrix and the qualification scores , we can estimate the offensive power ratings by solving a system of linear equations. Before enough matches have been played, the solution will not be unique, and we use Gauss-Seidel to report a least-squares estimate. Since the score breaks down into three phases, , we also estimate OPR scores , , and for each phase.
Defensive Power Rating
The defensive power rating (DPR) for a team is calculated by iterating through the list of completed matches and using the calculated OPR values to predict the outcome of each match. For each match, for both alliances, the difference between this expected outcome and the true outcome of the match is credited to the defensive utility of the opposing alliance. For each team, we sum up these differences and solve a linear system similar to the one above using this new tabulated data. Note that a team’s DPR can be negative!
Calculated Contribution to Winning Margin
The calculated contribution to winning margin (CCWM) for each team is calculated by summing up the alliance score difference for each team for each match and solving our favorite system of linear equations for the x vector with these margins in our b vector. Note that CCWM can be negative for a team if its allies consistently do worse than expected!
Conclusion
As they say, all models are wrong—and ours is especially wrong! In particular, a team’s ability to score points is assumed to be independent of the defensive prowess of the opposing team. Nevertheless, we found that OPR successfully predicts the winner for between 80-90% of matches. Incorporating DPR yields a marginal improvement.
Our scouts used AASK throughout the 2013 season to automate data collection and to inform the alliance selection process. During competitions, it was always exciting to compare early predictions against the final results. By comparing against data collected manually, we also noticed some interesting patterns:
- Due to the structure of the game, robots tend not to collaborate or interfere too much with one another during the autonomous and climbing phases of the game. As a result, AASK is remarkably accurate at predicting scores for these two phases.
- Scores were generally higher on the second day of competitions than on the first, which we attribute to drivers’ skill improving as they get more practice on the field.